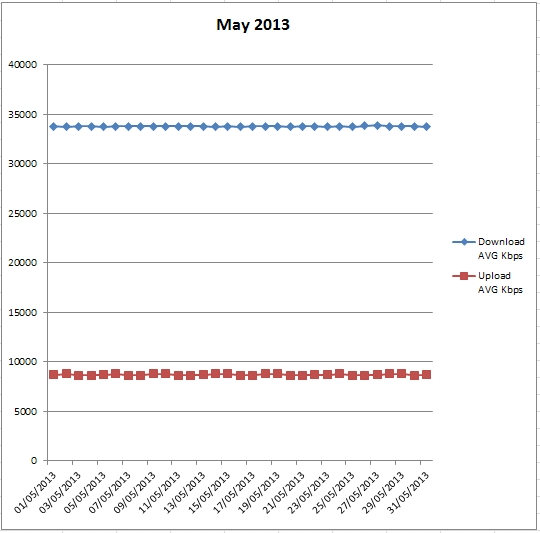
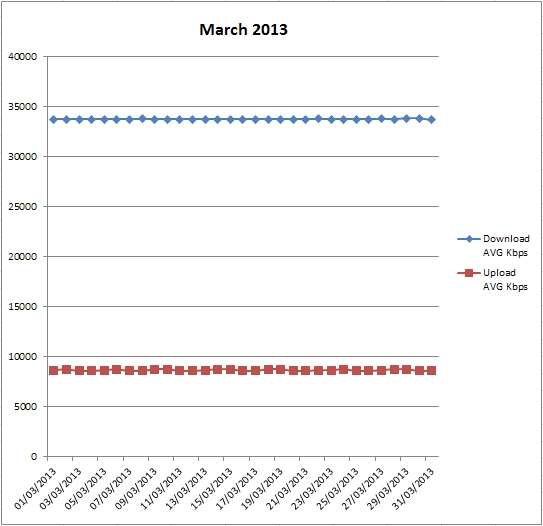
This will be the last time that I will be posting these figures in this format. Up until now I have been collecting the data manually, using a spreadsheet for collation and screen snapping an image to post into this blog. As you will see from the posted May 2013 figures below, much remains the same in that I am still maintaining a steady 32Mb (average) download speed.
Is there anything else that I can check that might be helpful?
I have used part of the Sam Knows website for many years as they have always seemed to be the one with the most up to date information about exchange configuration changes and service availability. In early May they emailed me and asked if I would like to participate in their Broadband Performance Monitoring Survey which allows them to build a UK wide picture of the sorts of broadband performance that we are getting from our Internet Service Providers.
To participate in the survey, you will need to install a ‘white-box’ in between your broadband socket and your router, the ‘white-box’ (mine is actually black) monitors the technical side of your connections performance – not what you are looking at or what files you are sending (we can leave that to GCHQ & the NSA!! Just kidding) and keeps track of a set of figures which can be reviewed via a dashboard or via monthly reports that are sent to you. Does this interfere with your connection performance? No, look at my figures.
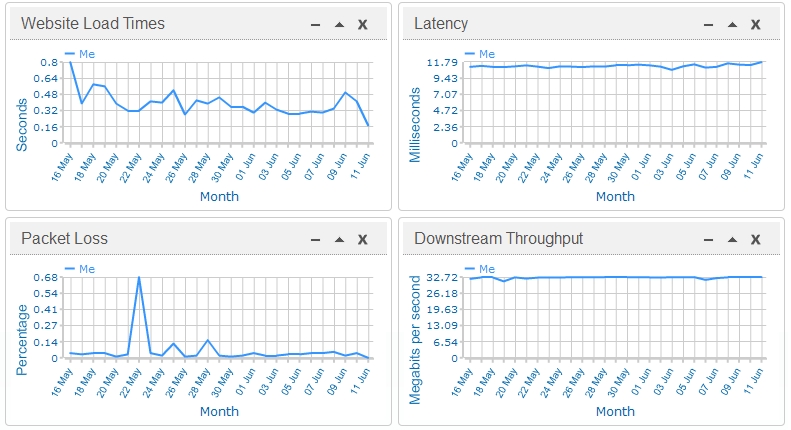
The screen snap below shows the main dashboard display, which as you can see shows that the average download speed is much the same as I have been gathering via my ‘handraulic’ method, these figures are from first use in May till today.
What is also included in this dashboard view are figures that show Website Load Times, Latency & Packet Loss all of which will affect your on-line browsing experience.
A word about each of these…
- Website Load Times – This test emulates that process and shows the average time in seconds of how long a selection of popular web sites took to load. Note that results may vary according to changes in the websites being visited. The lower the figure is a better loading speed. For example, you may have a download speed of 32MB, but if the ‘distant’ website can’t serve out the pages very fast, no amount of download speed will help the page load faster.
- Latency – This can effectively be thought of as the responsiveness of the connection between your home and servers out on the Internet. Times are recorded in milliseconds. The lower the figure is better.
- Packet Loss – Some broadband providers have been known to suffer high packet loss at peak times. If this is the case for your ISP, then you may find that time sensitive applications such as Voice over IP (VoIP) and on-line gaming will suffer. Packet loss is recorded here as a percentage, The lower the figure is better.
There are other performance figures that can be obtained simply by altering the dashboard look.
Sam Knows will also send along a monthly report showing the main points of performance and if there are any issues, which can then be forwarded to your ISP if required. I would encourage everyone to sign up and participate in this survey.
I’ll be posting future reports here as I get the monthly reminder report cards and hopefully will continue to have an error free connection to the Internet.